- Captured through relaxation contrast, such as T1-weighted images (i.e. MPRAGE)
- Using the Pig Brain Atlas, the brain can be segmented into:
- White matter
- Gray matter
- Cerebral spinal fluid
- Individual regions
- Utilized to identify discrepancies in absolute & relative volume to assess volumetric growth trajectories
A Deeper Dive
Multimodal Neuroimaging
With multimodal neuroimaging, multiple features of the brain can be assessed non-invasively. Specifically, by utilizing various sequences one can measure regional volume, microstructural properties, and estimates of myelin content.
Expand each property below to learn more.
- Captured through diffusion weighted imaging (DWI) which models the diffusion of water through the brain
- Several diffusion metrics can be derived to estimate fiber direction and integrity
- Axial diffusivity (AD) = diffusion rate along the fiber
- Radial diffusivity (RD) = diffusion across the fiber
- Mean diffusivity (MD) = average diffusion rate
- Fractional anisotropy (FA) = directional coherence of water movement
- Acquired through myelin water imaging (MWI)
- Myelin sheath is a layer of fatty tissue that surrounds an axon to ensure efficient and effective communication
- Within the lipid bilayers of myelin, there is water trapped that has different relaxometry properties compared to free floating molecules
- A myelin water fraction (MWF) can be derived to map myelin in the brain
The Challenge
However, although multimodal neuroimaging is useful to gain insights on how environmental influences may impact the brain longitudinally, there remains a major challenge.
How do we know the true biological significance of MRI results?
 Using various histological measures, we can assess the microstructure of different regions.
Our lab has particularly been interested in the hippocampus - a mixed gray matter and white matter region important for memory function.
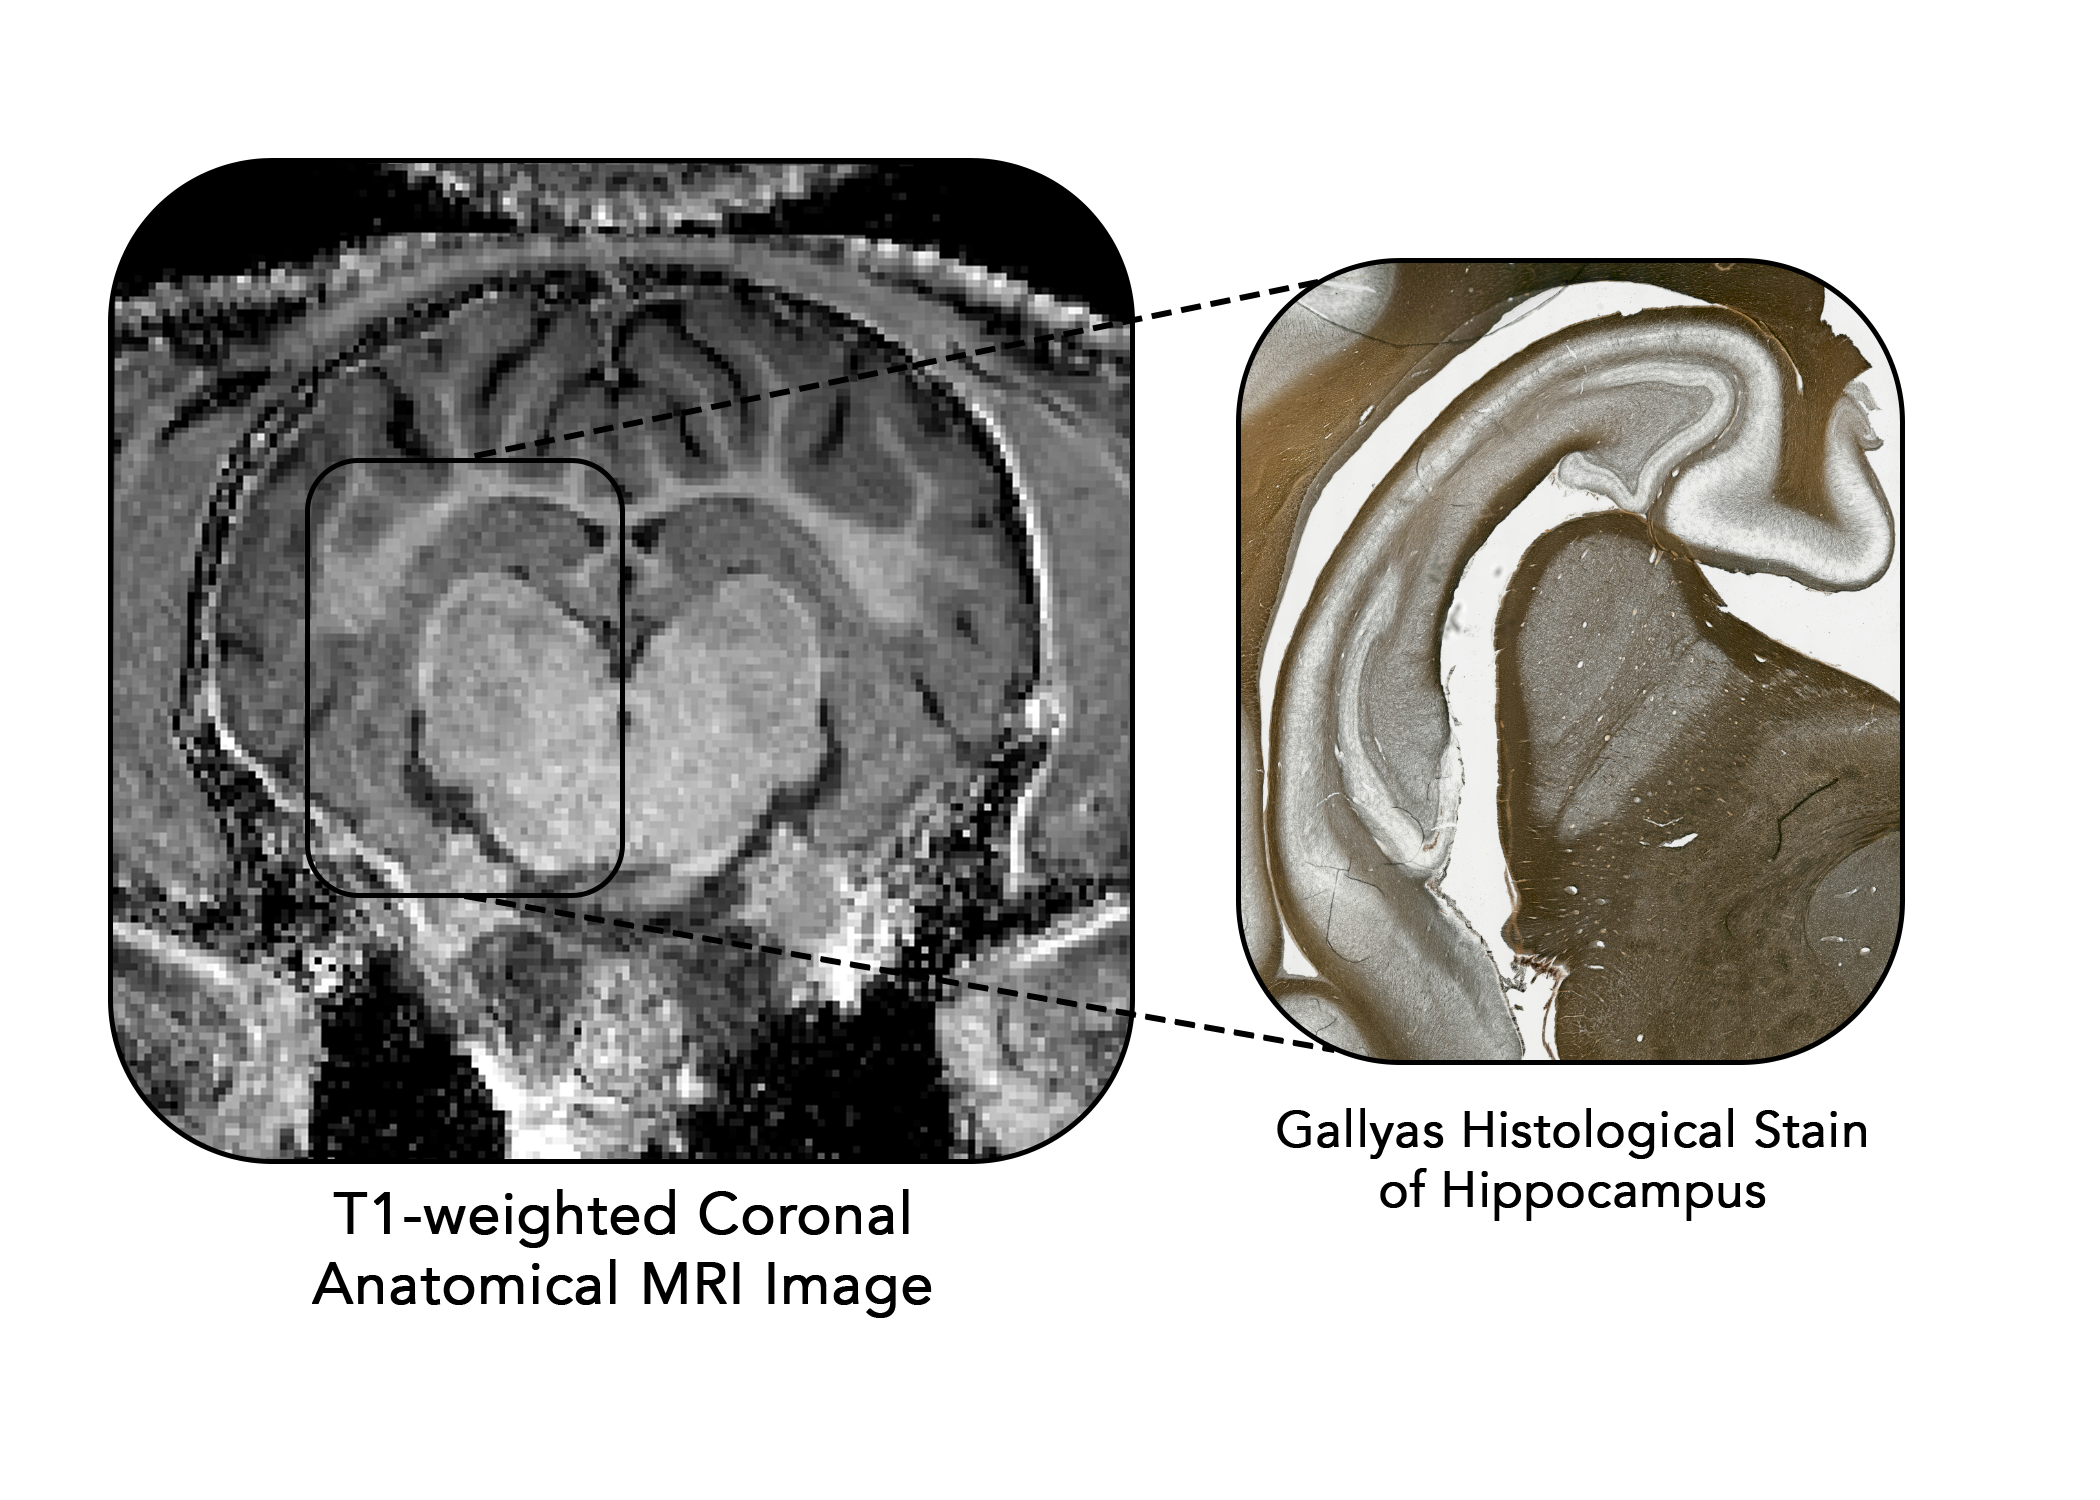
Using different stains, we can obtain different microstructural information about the tissue.
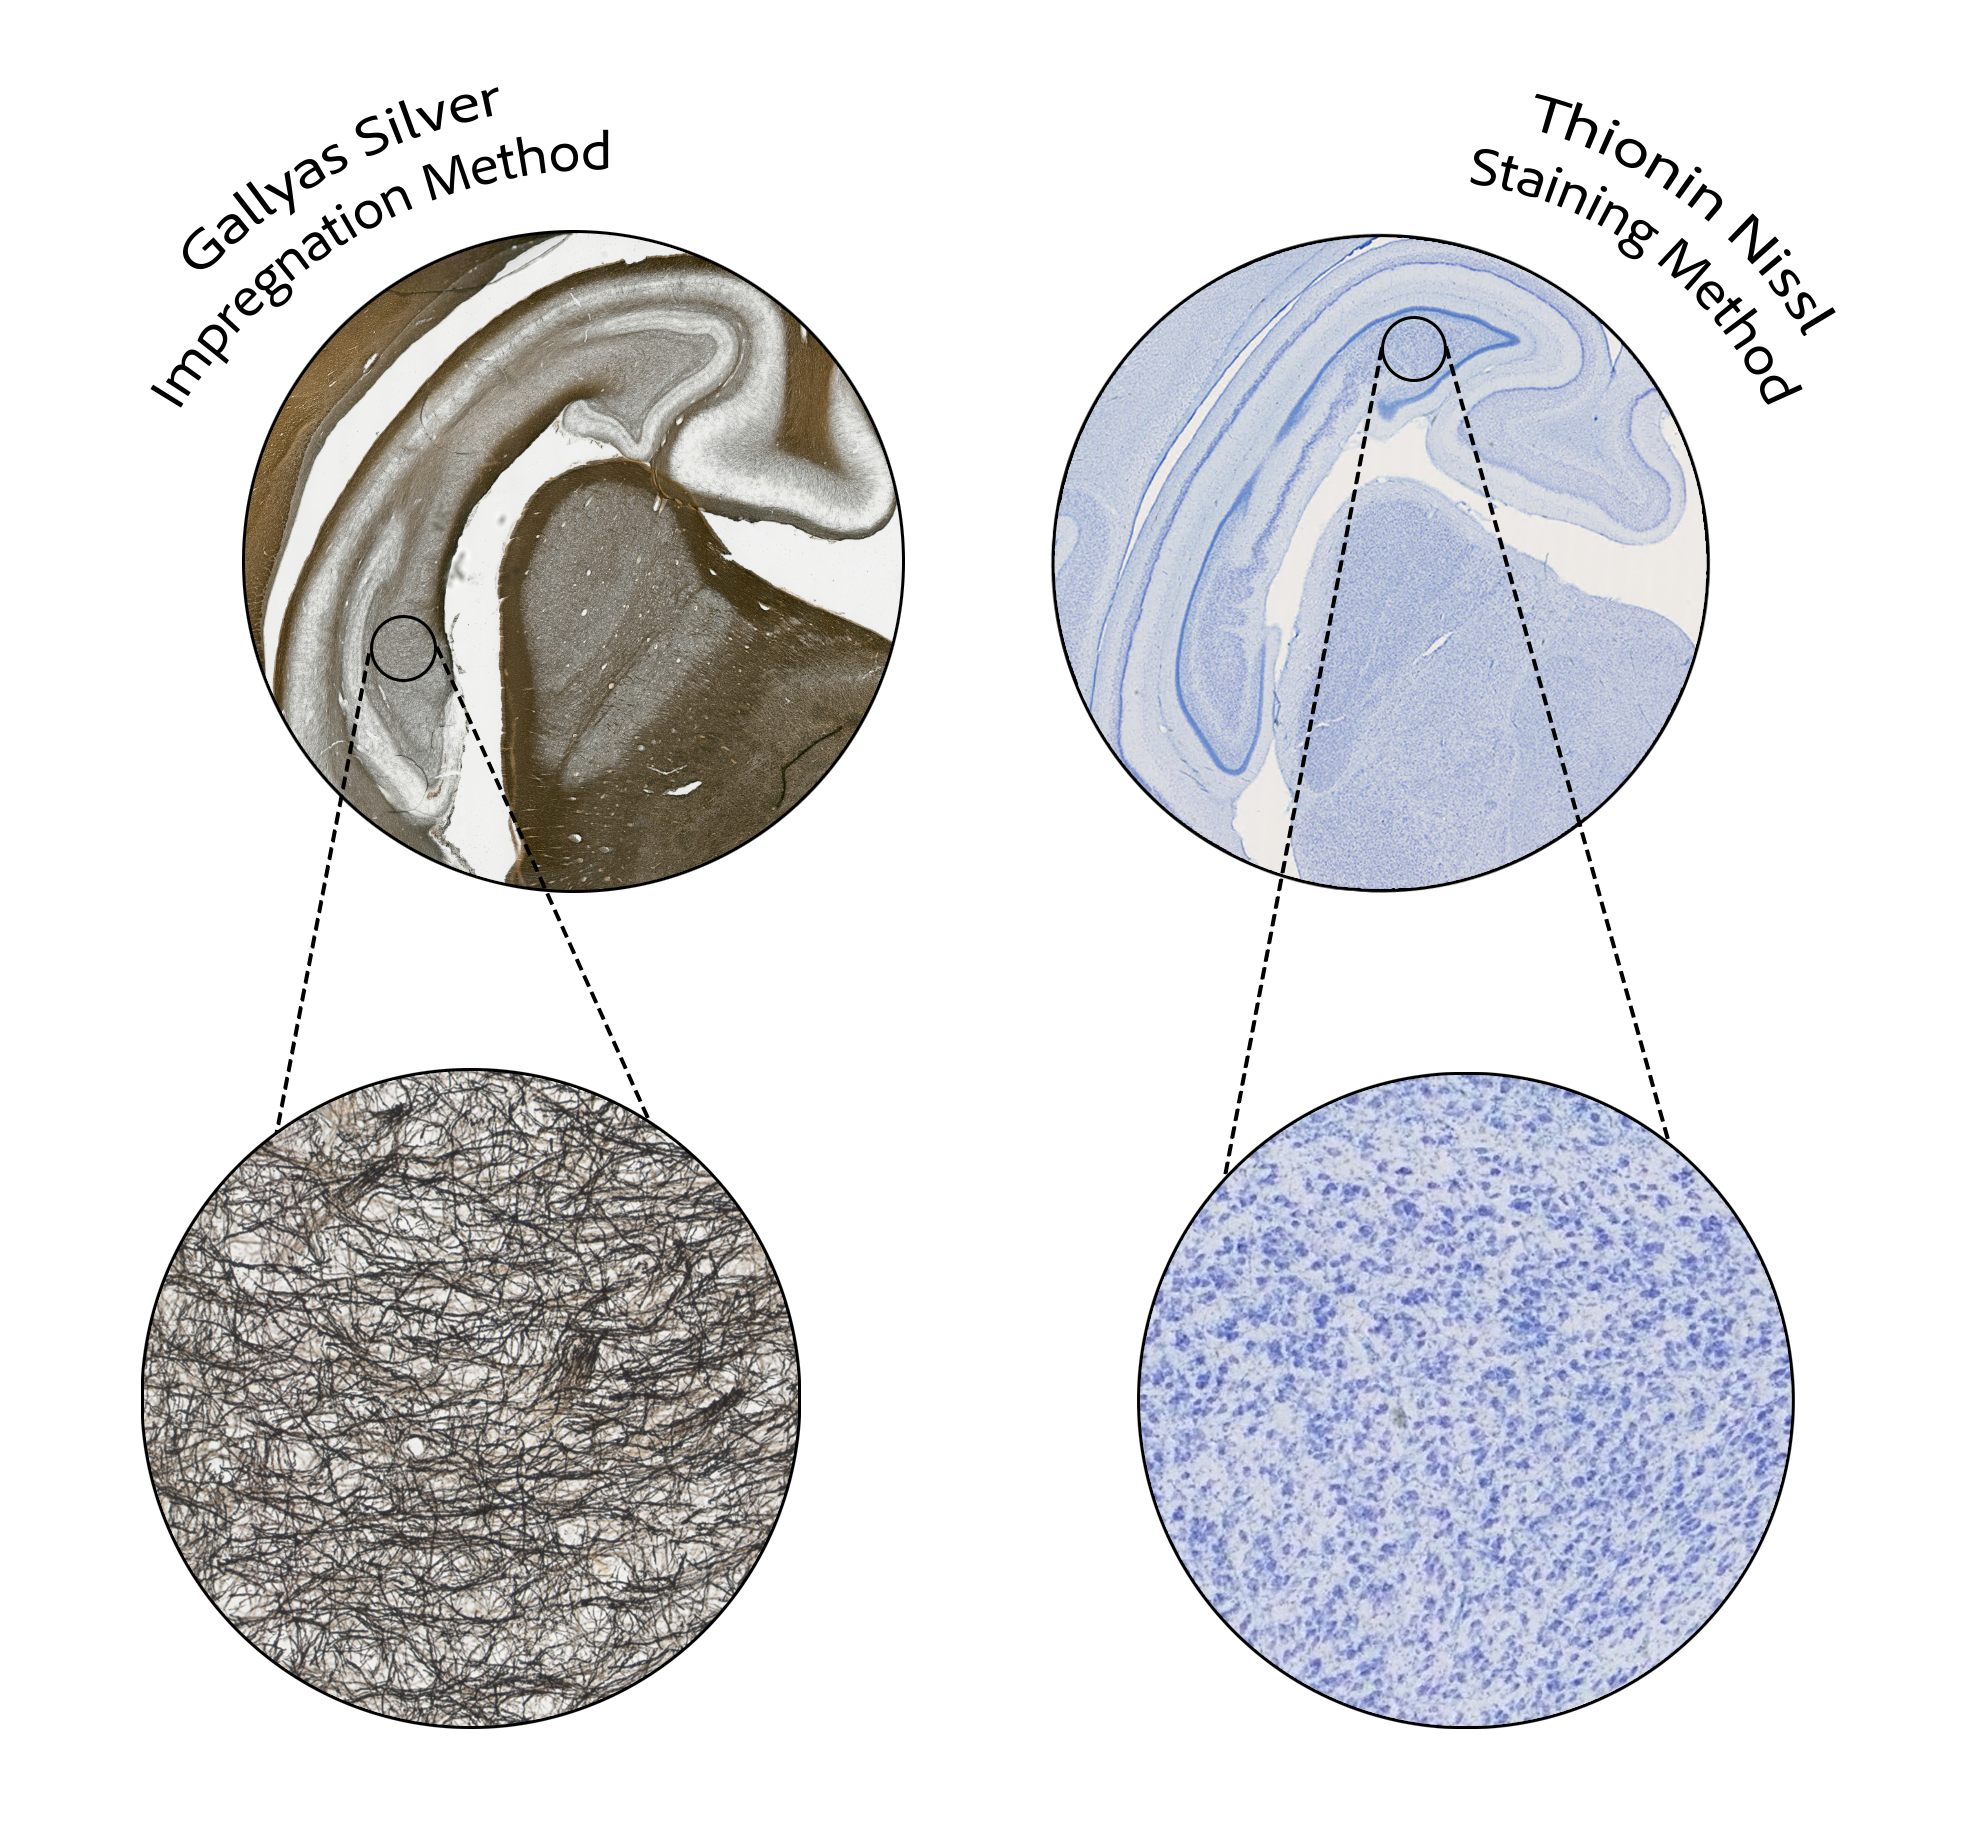
Individual myelin fibers are darkly stained with this method allowing quantification of myelin density within a tissue.
Individual neuronal cell bodies are stained a blue-purple color allowing quantification of cell density and distinction of various cellular types.
Current Work
Recently, our laboratory was interested in determining if there are any sex-specific neurodevelopmental differences in pigs.
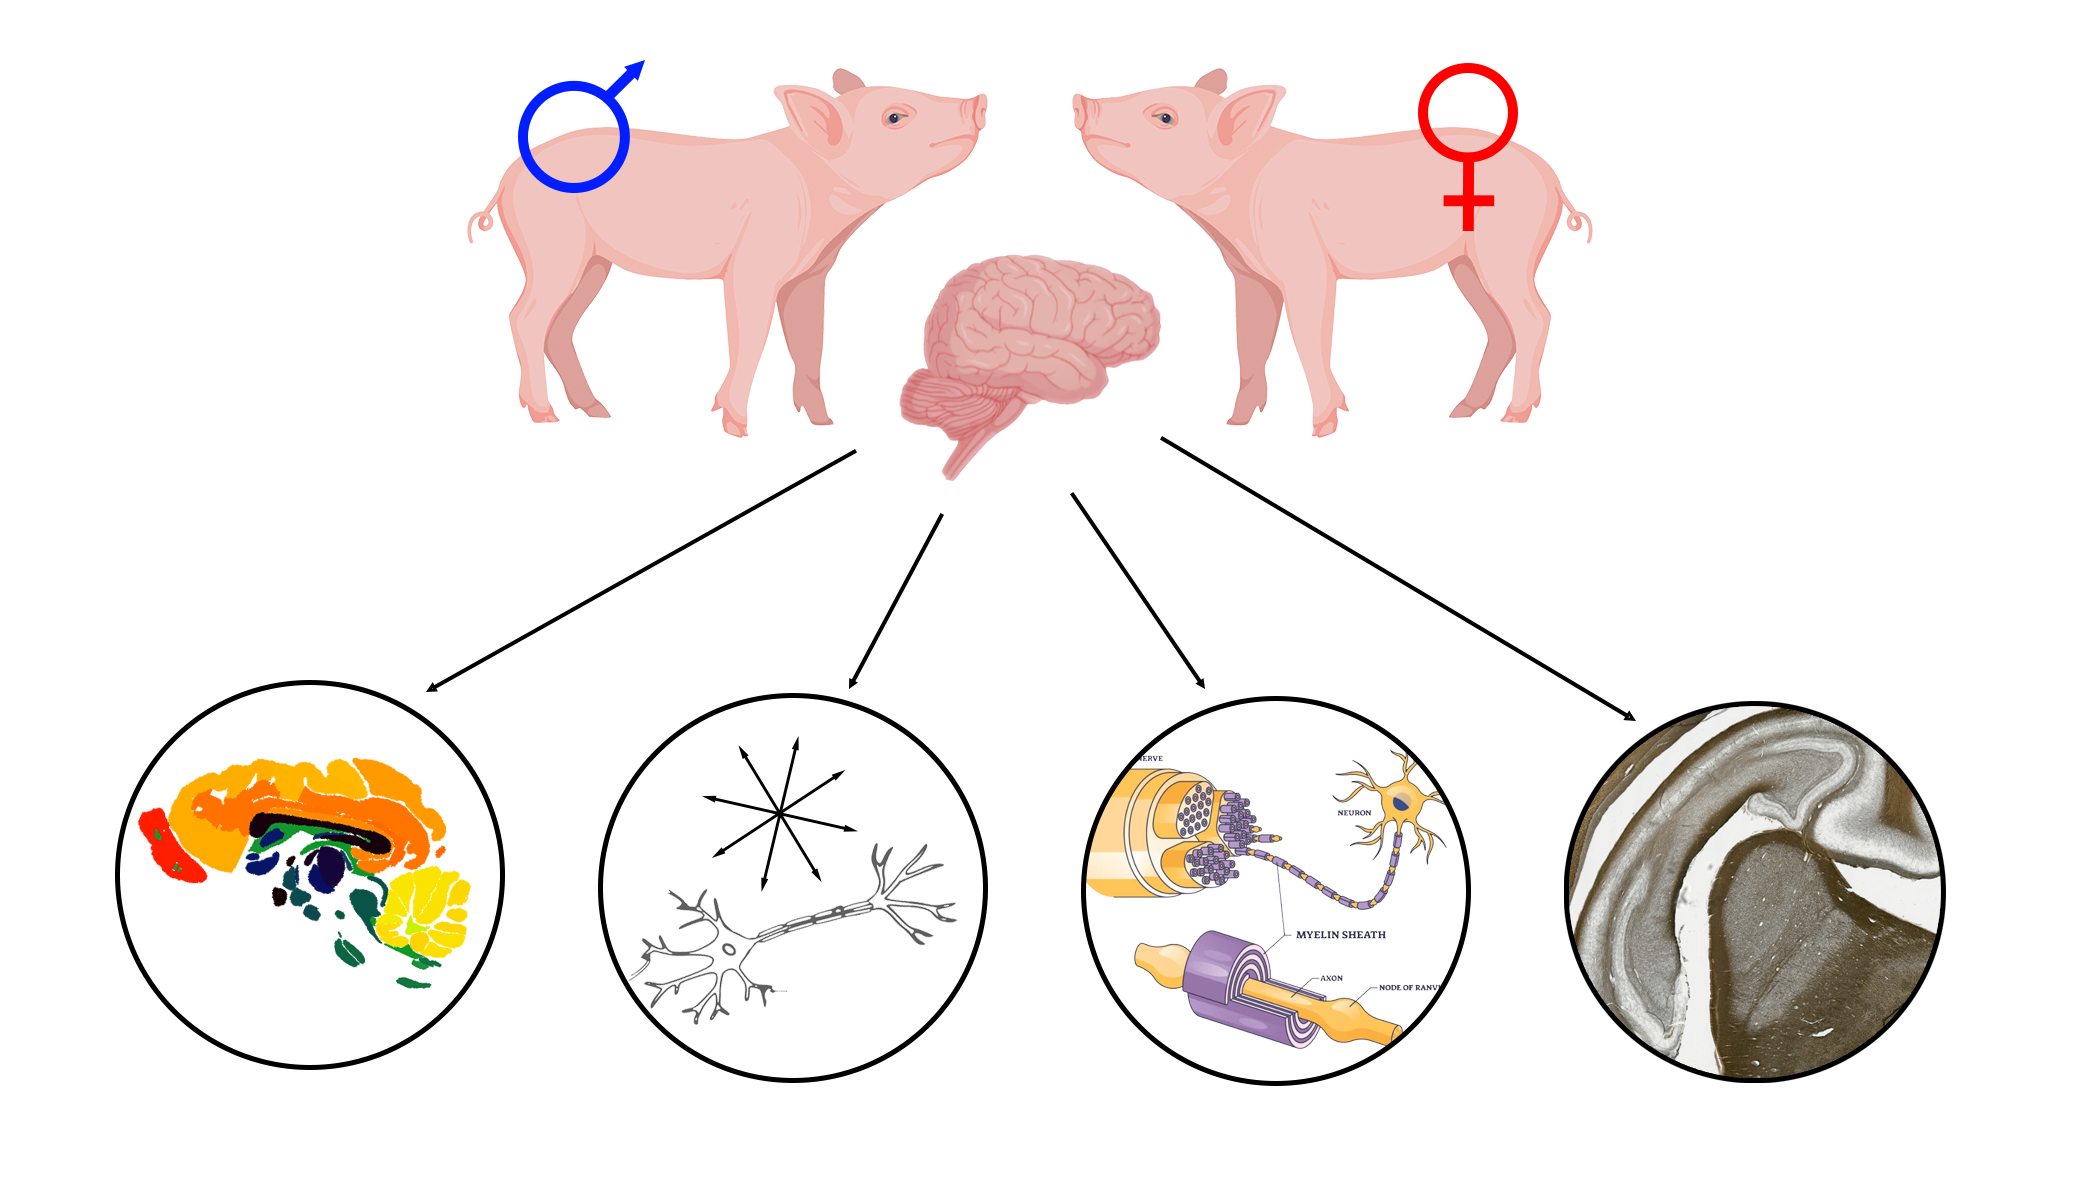
Using multimodal neuroimaging and histology several sex-specific differences were identified in the hippocampus.
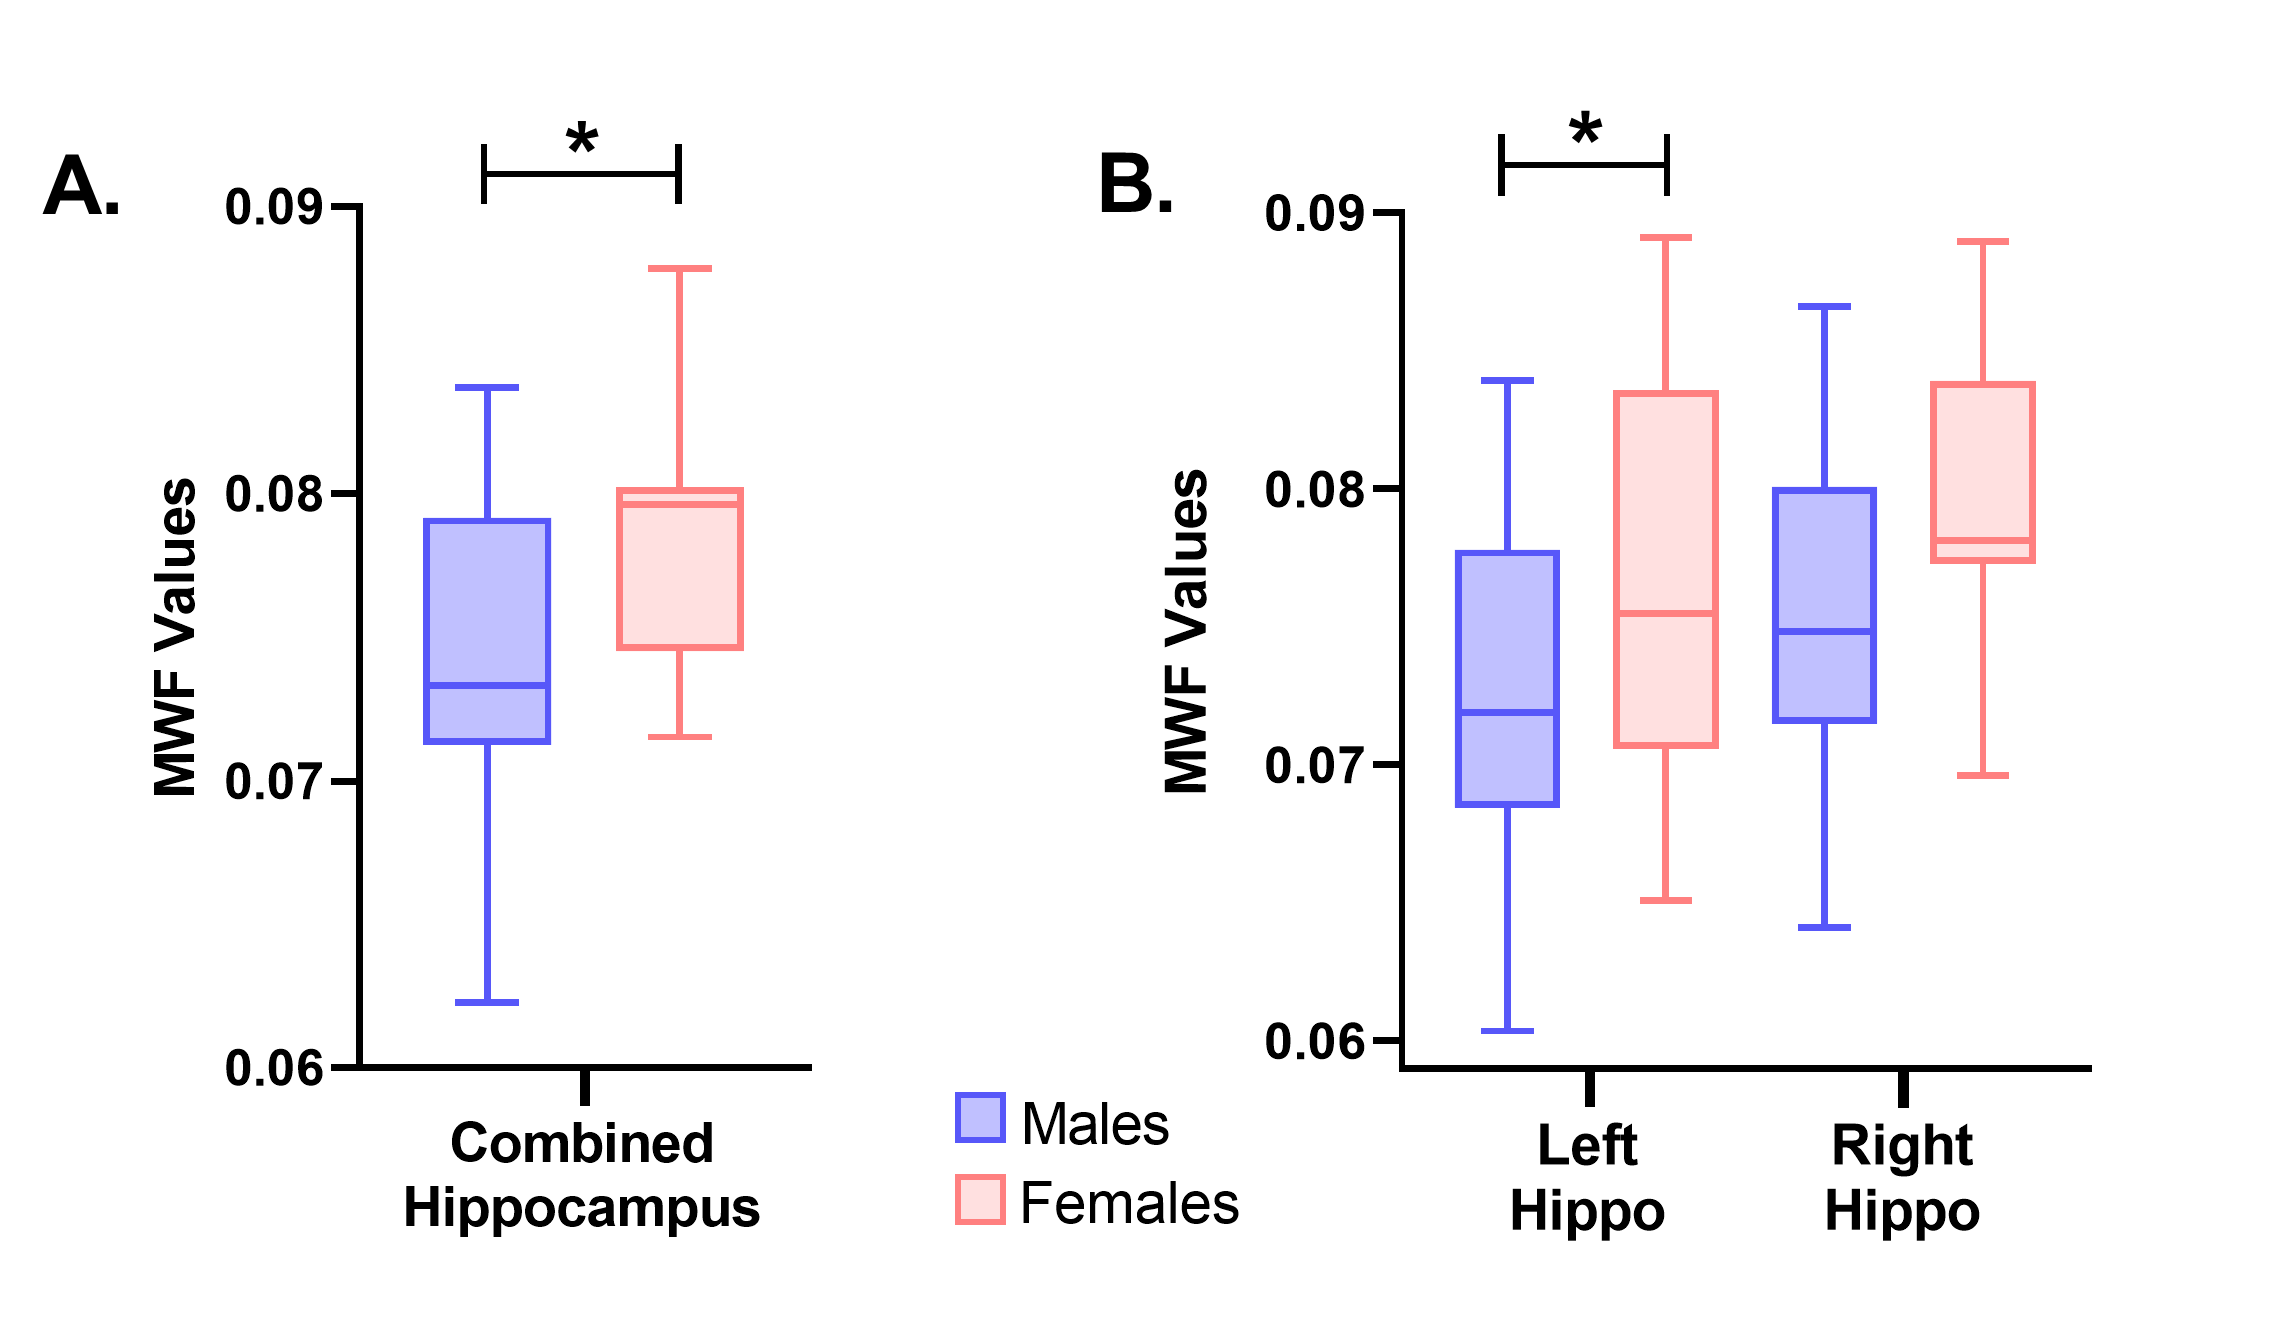
Specifically, female pigs were observed to have higher MWF values in the hippocampus as a whole (A) and more specifically in the left hippocampus (B) compared to male pigs.
Furthermore, through multiple regression analyses, it was determined that AD and MD, measures derived from diffusion tensor imaging, were positively associated with myelin density independent of sex.
Pig Imaging Group