Why Pigs?
The Pig as an Animal Model
For decades, the pig has been utilized as a preclinical animal model across a multitude of fields, but
why has it gained so much popularity?
It is due to the many shared features with humans:
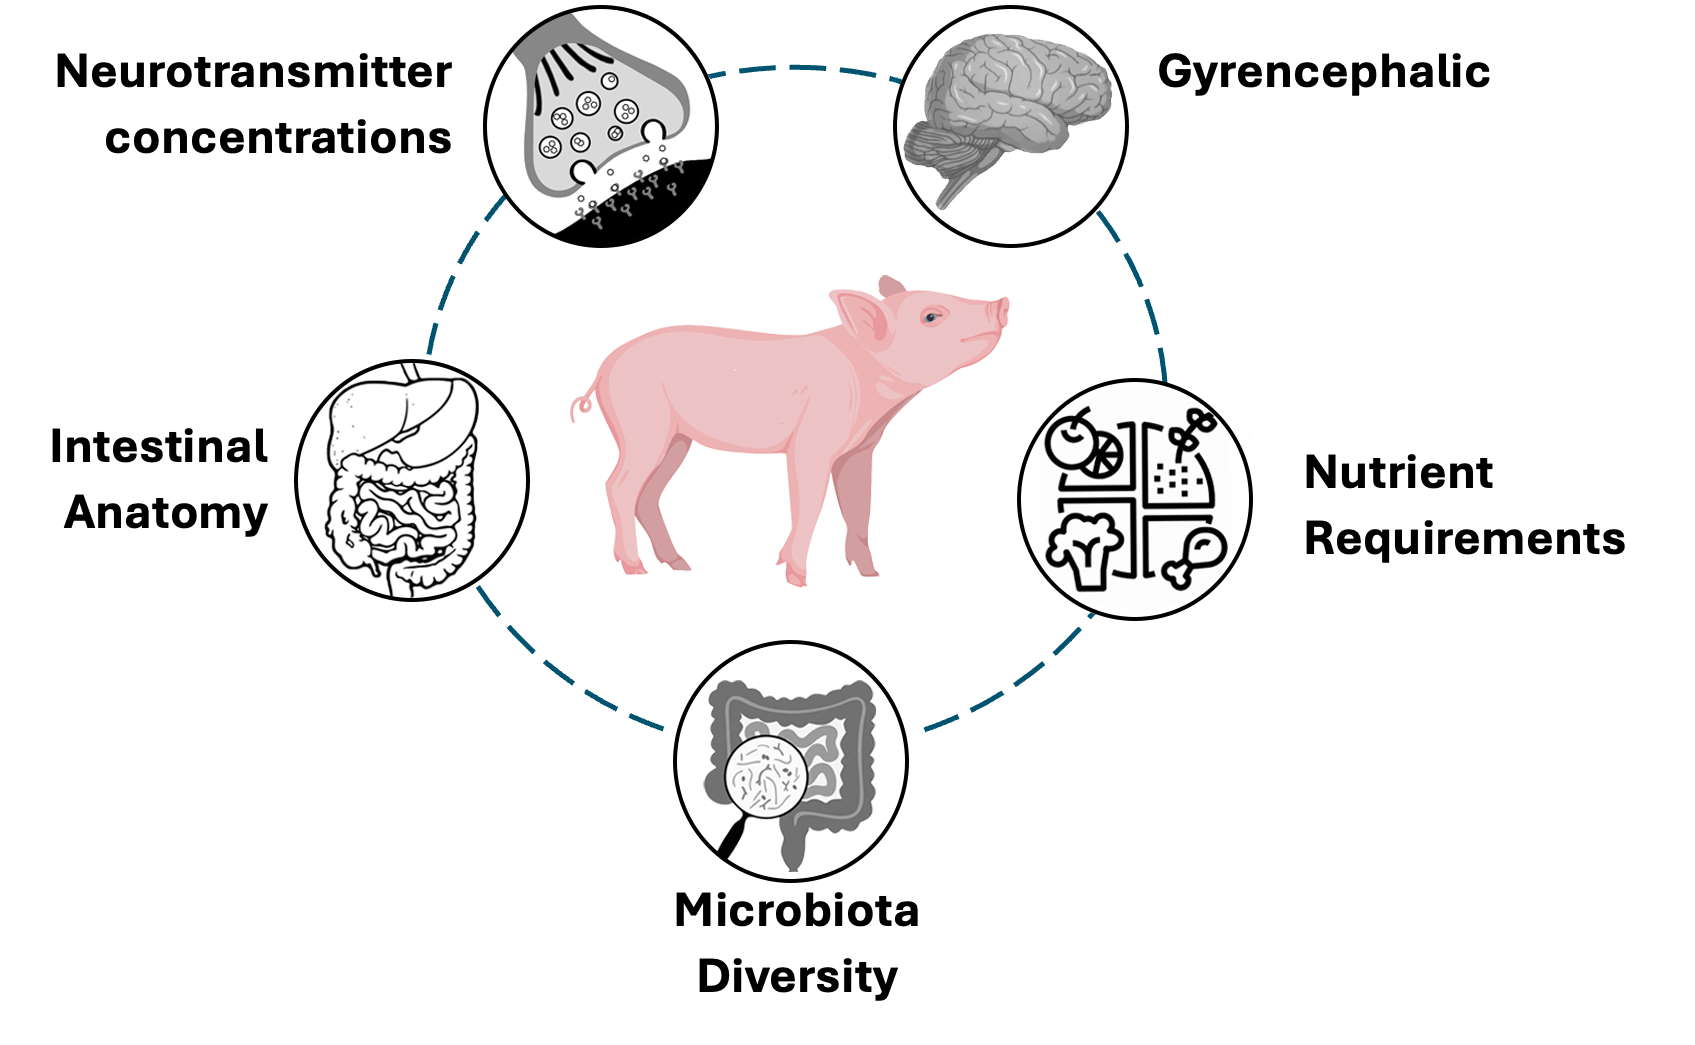
Which makes them an excellent model for studying the microbiota-gut-brain axis.
The Current Challenge
A significant obstacle is how do we translate what we find in the pig to the human?
The differences in timing of development make translation a difficult task.

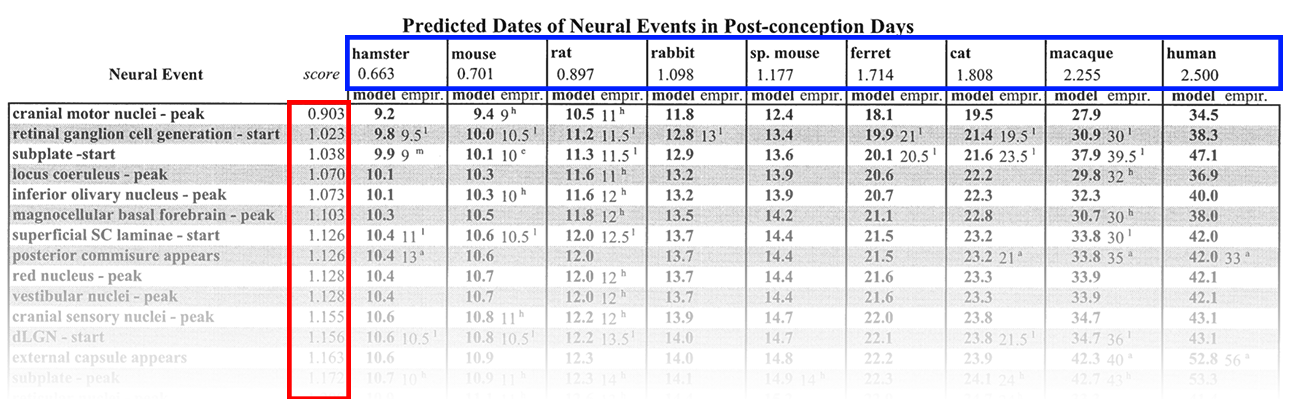
This was true for many other species, which led Clancy and colleagues in 2001 to create the Translating Time model which estimates the timing of 95 neurodevelopmental events across 9 species.
With this model, one can estimate when a neurodevelopmental event, such as peak of neurogenesis of the cranial motor nuclei, in a species like the hamster occurs and directly compare it to when it occurs in the human. Each species is assigned a species score and each event an event score.
Where does the pig belong?
How close in neurodevelopmental proximity is it to the human?

Establishing the Pig as a Neurodevelopmental Model
Our Objective
To conduct a comprehensive literature review to identify as many of the 95 neurodevelopmental events in the pig as possible to enable a chronological comparison.
The Results
- 30 neurodevelopmental events identified.
- Two optimization procedures utilized.
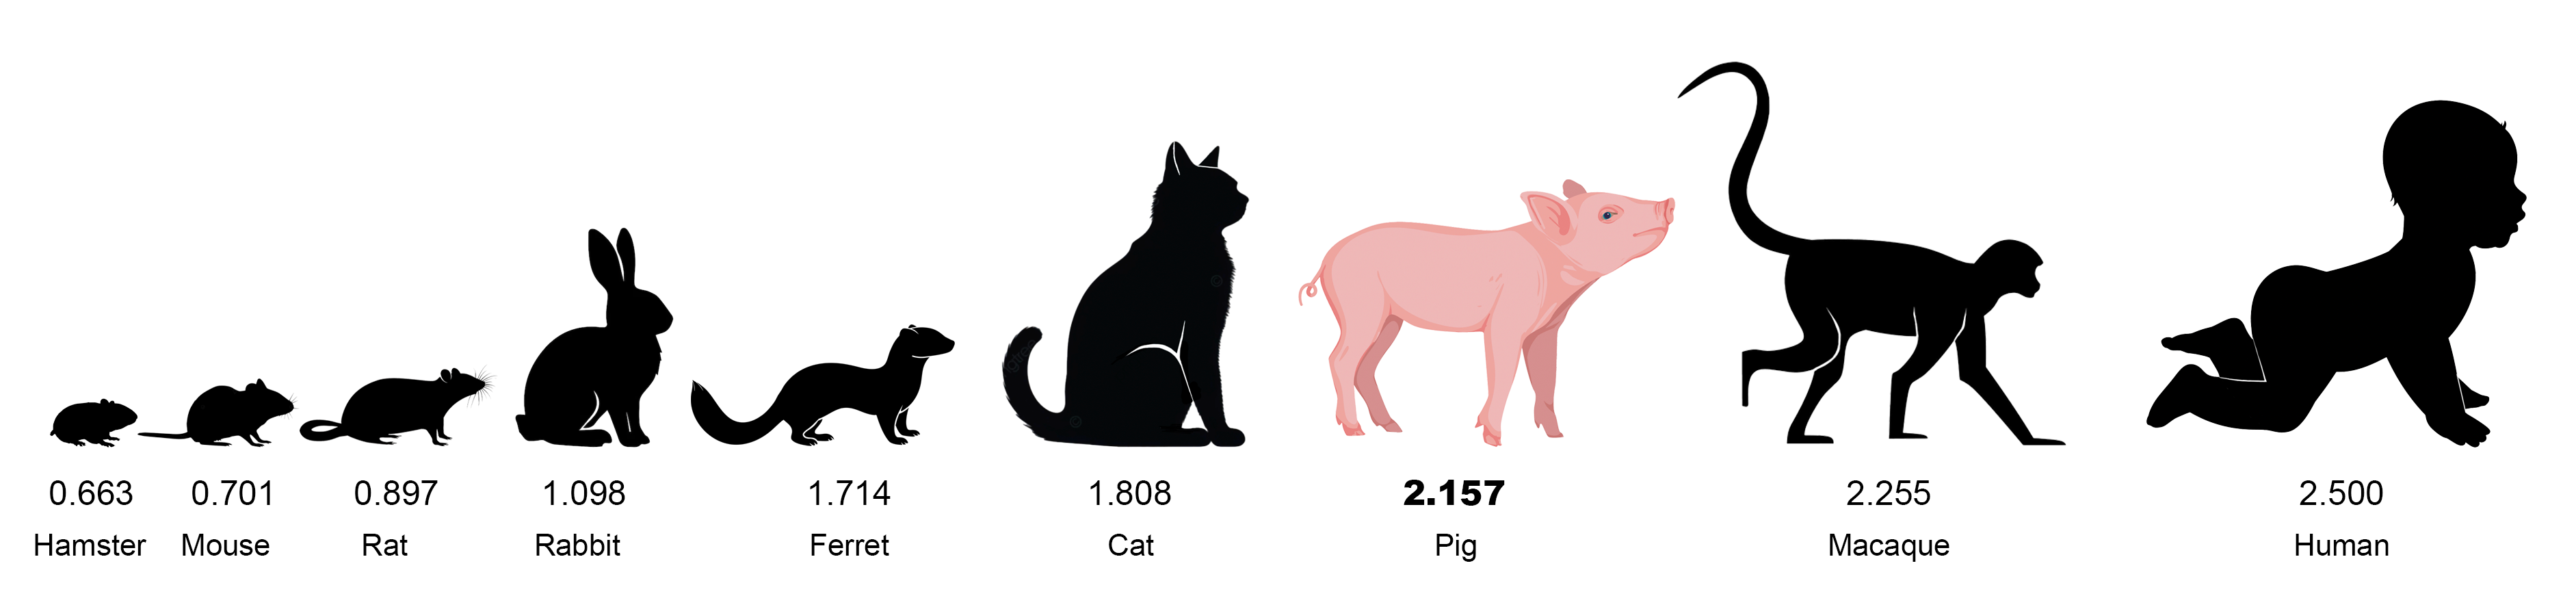
- The pig species score was determined to be 2.157 placing it right between the cat and macaque.
Interactive Translating Time Graphic
As a result of our comprehensive literature we have created this interactive graph that establishes a chronological neurodevelopmental timeline across four species: the mouse, pig, macaque, and human.
- All 95 neurodevelopmental events with corresponding event scores from 0.903 (Cranial Motor Nuclei - peak) to 2.546 (Eye Opening) from the Clancy et al., (2001) manuscript are included.
- To find a specific event and on which post-conception day it is estimated the event occurs, use the drop-down menu. The first event starts with the cranial motor nuclei - peak (corresponding post-conception days (PCD): Mouse = 9.39, Pig = 25.68, Macaque = 27.87, Human = 34.38) and the last event is eye-opening (corresponding PCDs: Mouse = 30.24, Pig = 115.14, Macaque = 126.54, Human = 160.44).
- Using these 95 neurodevelopmental events, we estimated the resulting chronological timeline across all 4 species. Many of these post-conception days do not have corresponding events associated with them and are a rough estimate of where these different species are in terms of developmental time.
- In the original Clancy et al., (2001) model, PCDs for the macaque and human were adjusted if the event in question was part of the limbic (- 0.09031) or cortical (+ 0.21722) system. These adjusted PCDs can be found under the relevant events (if no adjusted PCD is listed, the event in question was not adjusted) in the text to the left. Read the original article to learn more.
Pig Imaging Group